|
|
|
|
Introducing BugCAD 2020 The future of Paleo/Geo plotting! BugCAD 2020
is the evolution of decades of paleo and geo charting programming.
BugCAD is now integrated with BugWin to create a seamless interface between data collection and graphing. The
real power lies in the user friendly interface, which makes
BugCAD 2020
easy enough to use even at wellsite.
BugCAD 2020
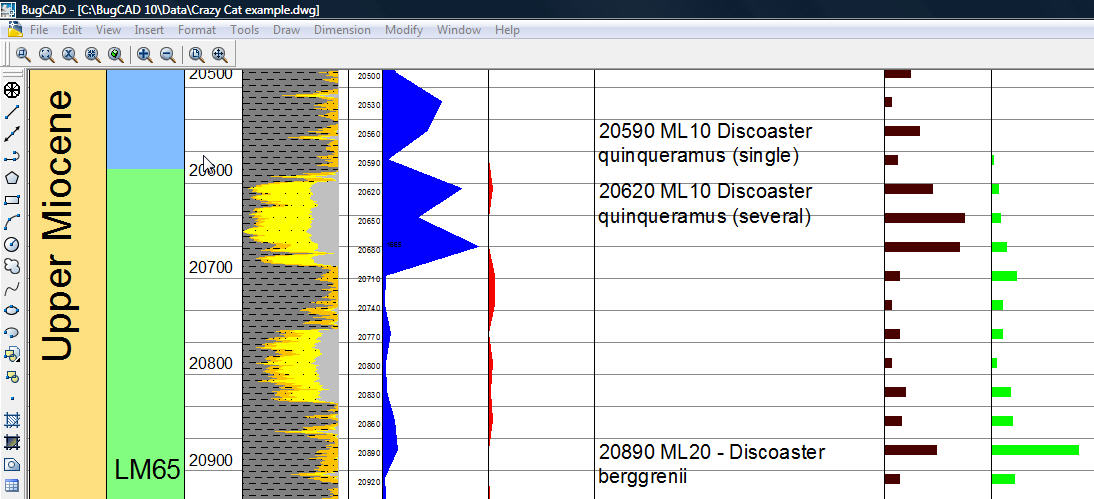
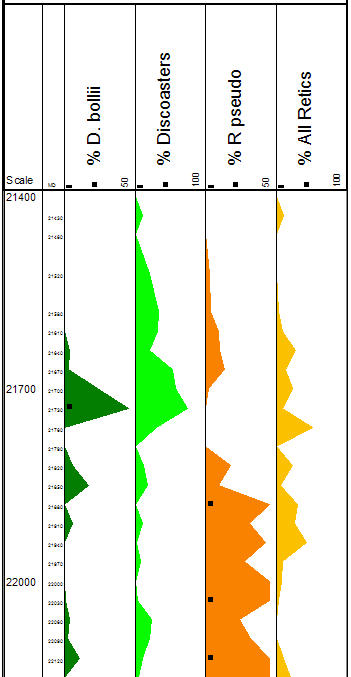
presents awesome graphical lithology, “sawtooth” or bar histogram style
abundance curves , the usual general distribution sections, E-logs,
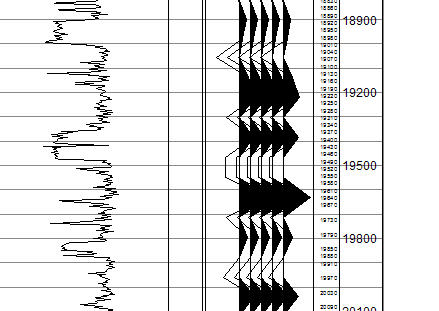
synthetic seismic (see below), paleo-bathymetry, colored
Age/Zone/Sequence Stratigraphy columns, and much more. Templates for
wells can be saved and then reproduced for similar wells with little
effort. Download the
high quality chart below in PDF format (2 meg). |
||||
 |
||||
|
Multiple Wells, unlimited number. Plot each bug to the same order, color, and scale for easy comparison. BugCAD 2020 has all of the annotation tools of modern drafting programs, so once the chart is created the user may add text, hatching, correlation lines and more. Download the high quality example chart in PDF format (575kb). 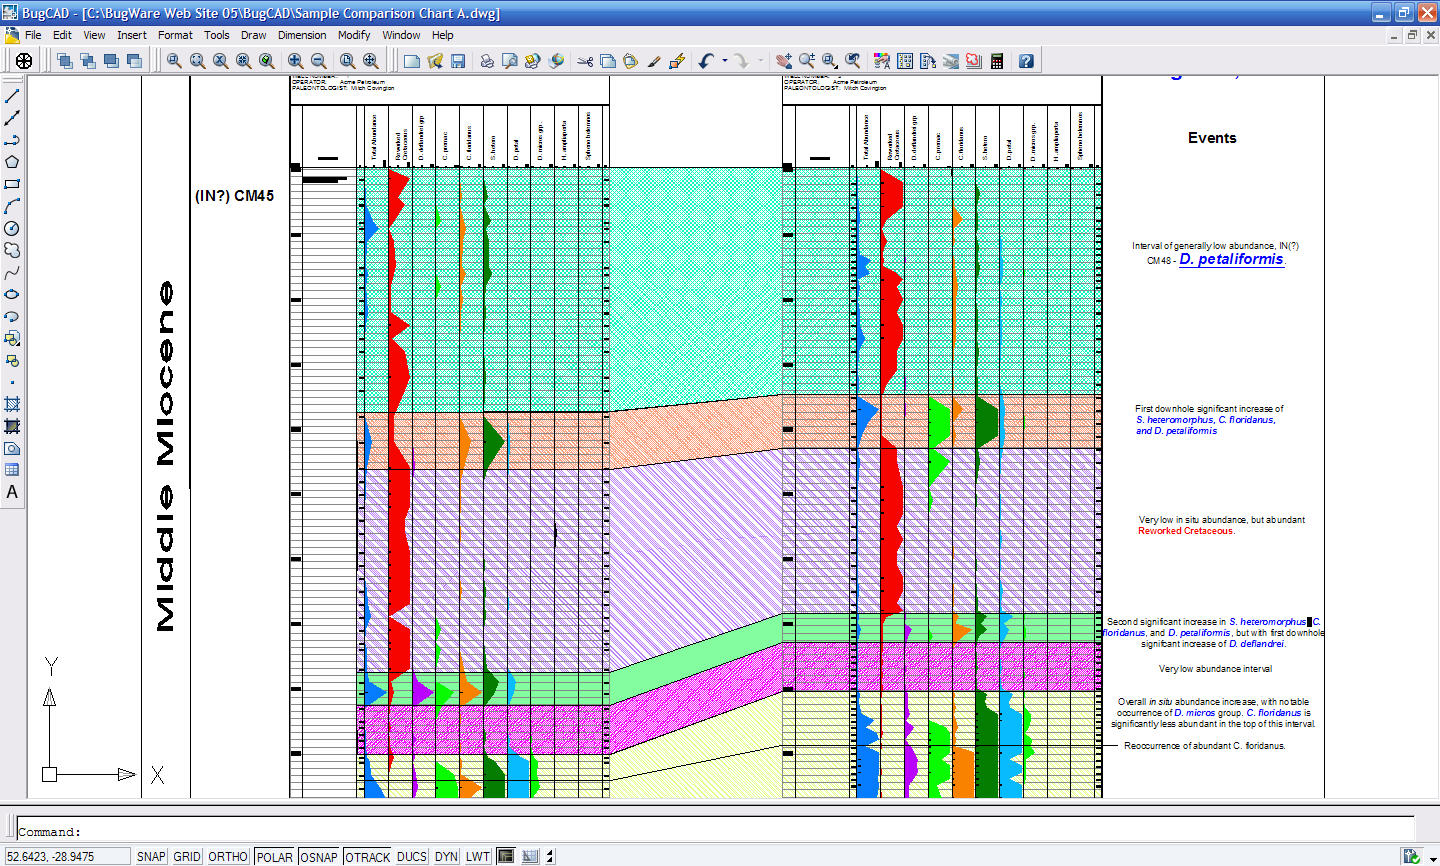 |
||||
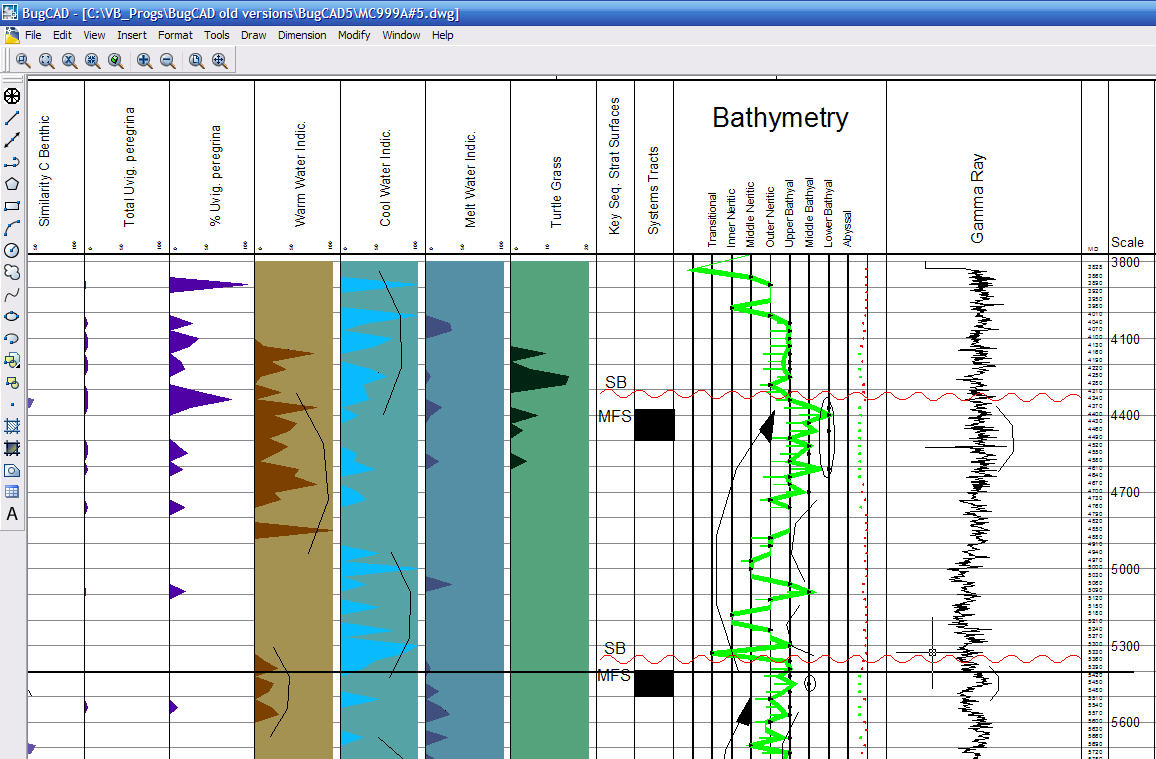
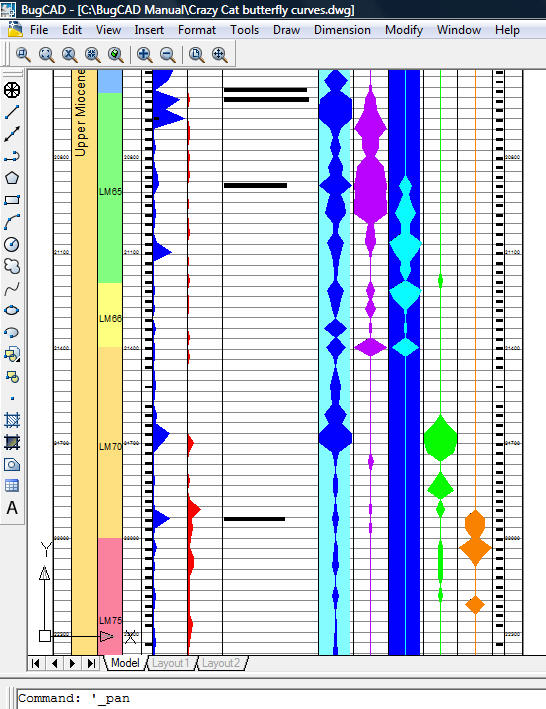
| Below is another example of a BugCAD chart with Bathymetry and various other curves displayed. This chart was annotated by the user with an unconformity indicator and other curved lines.
|
||||
| Electric logs and synthetic seismic columns draw
lightning fast with this AutoCAD powered drawing package.
|
 |
|
||
  |
||||